See underperformance and developing issues across your fleet — before they turn into downtime.
ARMA-Wind unifies SCADA, controller and sensor data from every turbine in your fleet into one operational intelligence platform — surfacing threshold-based warnings and underperformance early, so issues get caught while they're still manageable, not an outage.
Built for: wind asset owners, asset managers, operations managers and O&M teams running multi-site, mixed-OEM onshore fleets.
No SCADA replacement. No rip-and-replace. Reads data from your existing systems.
Platform Architecture
One intelligence layer connecting every turbine, SCADA and OEM system you run.
Nothing to rip out. ARMA-Wind reads from what you have — it doesn't replace it.
Wind Turbines
Every nacelle, gearbox, pitch and yaw sensor across your sites.
SCADA / OEM Systems
Multiple turbine manufacturers and models, read via OPC-UA, IEC 60870-5-104 and OEM data interfaces — no matter the mix.
ARMA-Wind
Normalizes, analyzes and cross-references data across your entire fleet in real time.
Analytics + Dashboards + Reports
Threshold-based alerts, performance benchmarks and reports for the people who act on them.
Beyond SCADA
SCADA shows you one turbine at a time. ARMA-Wind shows you the whole fleet.
Your SCADA Today
✕ Single-OEM view — a separate portal per turbine brand
✕ Raw signals and thresholds, no failure prediction
✕ Availability and curtailment reports built by hand
✕ Alarms fire without priority or production context
✕ Site-by-site view, no cross-fleet comparison
With ARMA-Wind
✓ Multiple OEMs and SCADAs normalized onto one screen, fleet-wide
✓ Threshold and pattern-based alerts surface developing issues early
✓ Reports generated from live data instead of manual exports
✓ Alarms ranked using configurable production and safety-impact rules
✓ Cross-site benchmarking across turbine models
ARMA-Wind is a data-driven operational intelligence platform. It uses rule-based and threshold analytics on your fleet data — it does not claim deterministic failure prediction.
Product Tour
What your operations and O&M teams look at every day.
Six views, one data model. Screens shown below are live ARMA-Wind product screenshots.
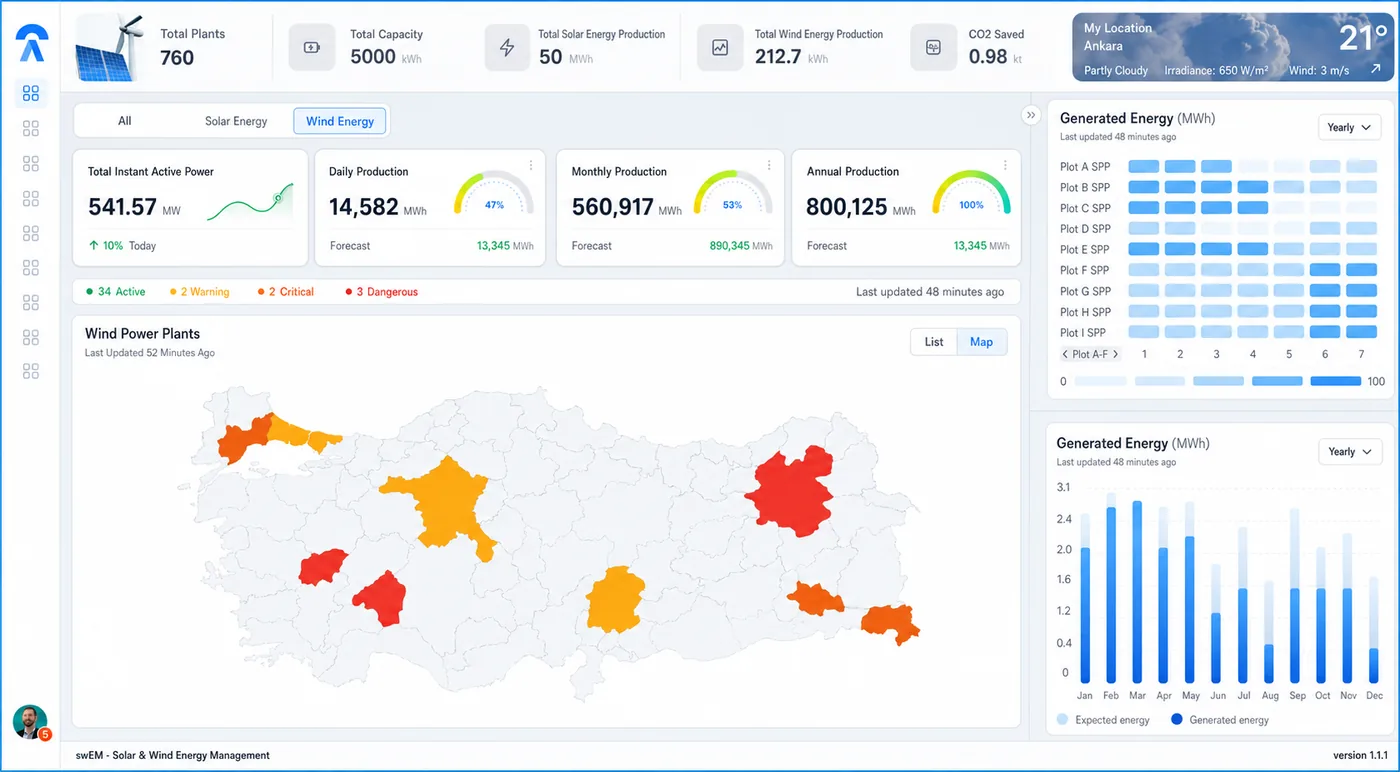
Fleet Dashboard
Every site and turbine, one screen. This is the view asset managers open first each morning.
- See which sites are dragging fleet availability down, today
- See active alarms ranked by configured production impact rules
- Compare production against the expected-power baseline across the portfolio
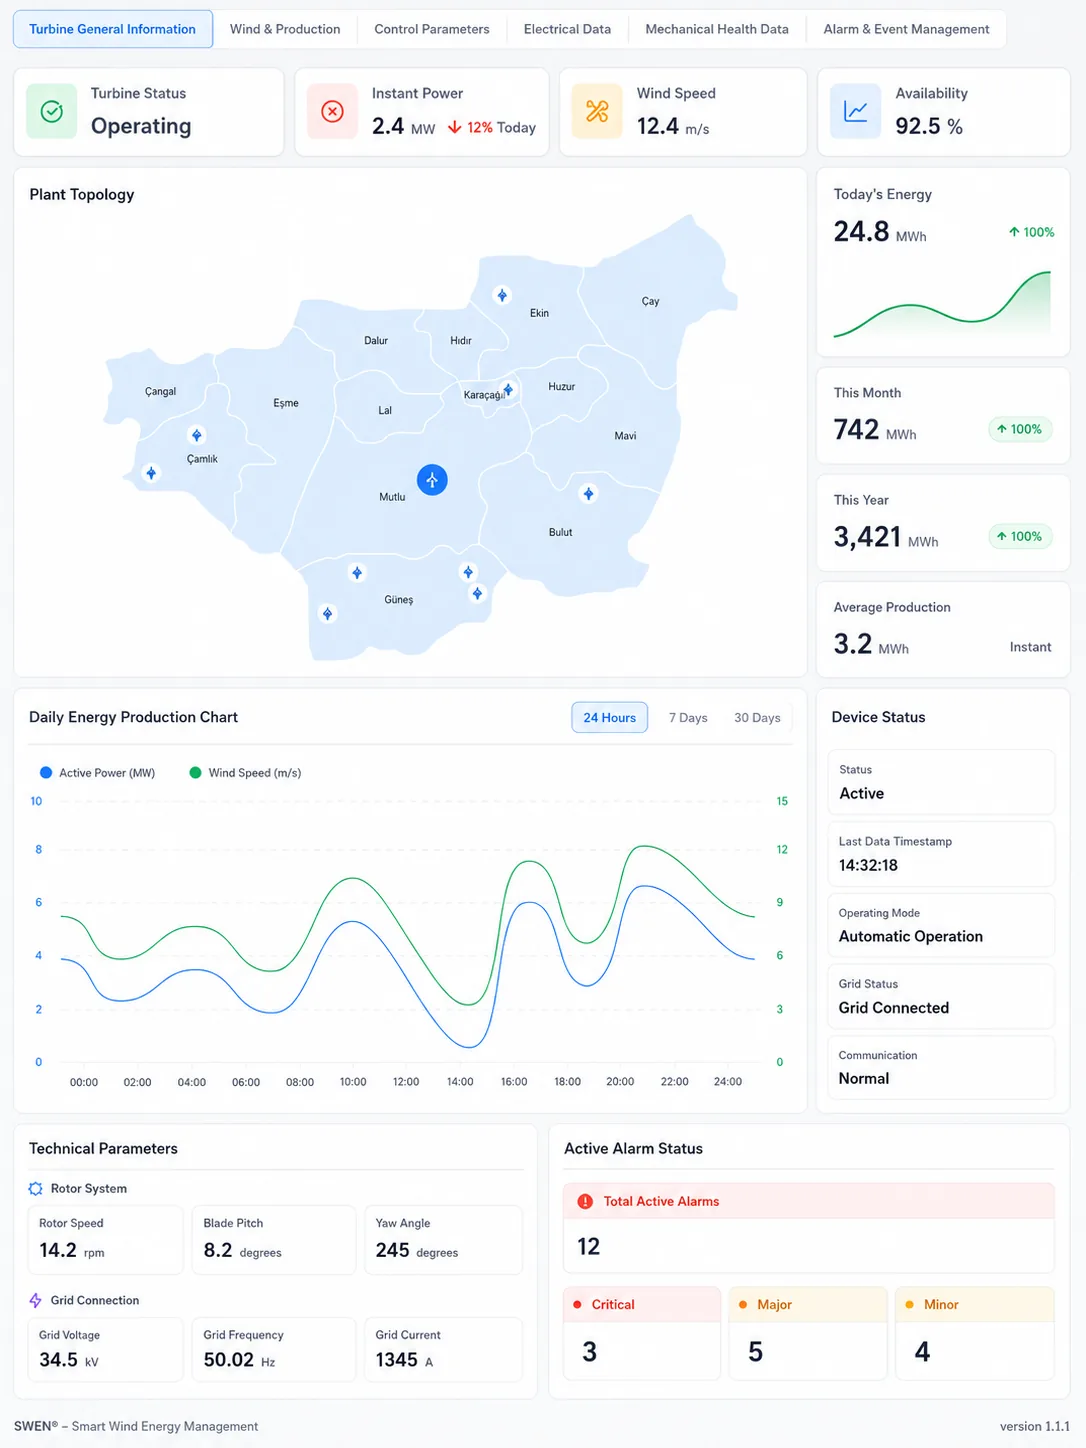
Turbine Overview
Drill into a single turbine's live state across the subsystems your team monitors.
- See RPM, pitch, yaw and nacelle temperature against the normal operating range you configure
- Catch subsystem values drifting outside range before they trip a hard alarm
- Give field techs one screen instead of several OEM apps
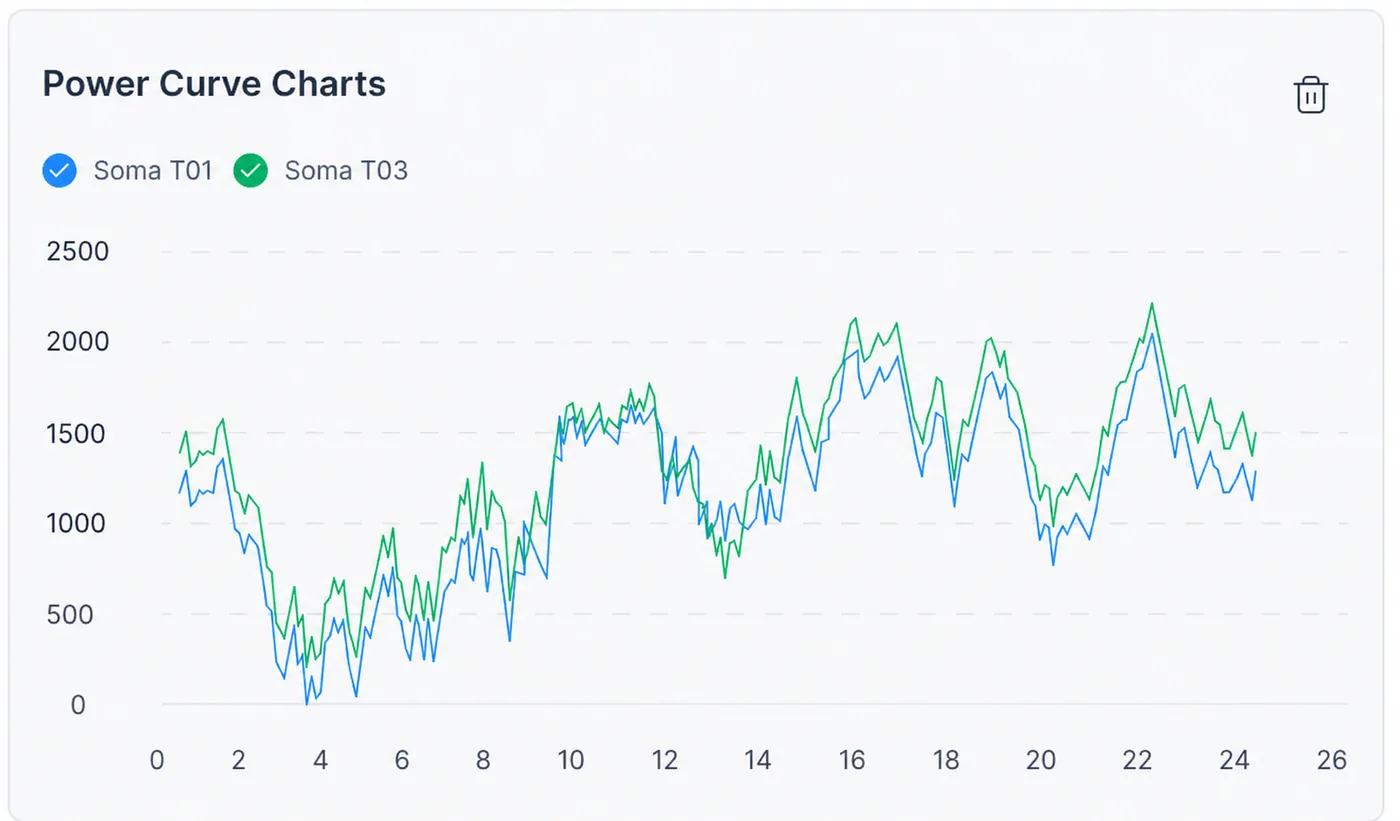
Power Curve Analysis
Plot actual power output against the manufacturer's reference power curve, per turbine, per wind-speed bin.
- Isolate turbines producing below the reference curve at the same wind speed
- Separate sustained underperformance from sensor noise or short-term terrain effects
- Build the evidence base for OEM warranty and performance discussions
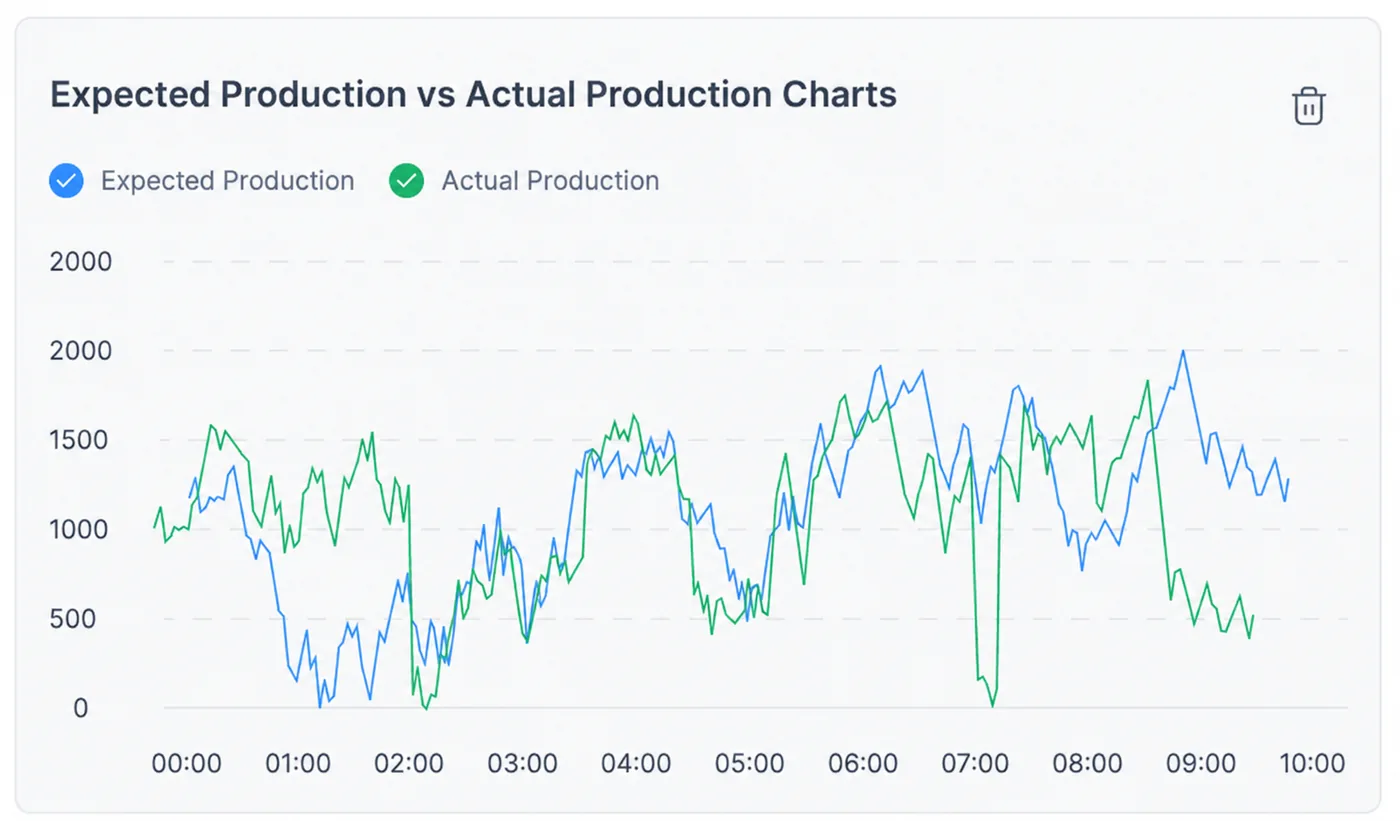
Expected vs. Actual Power
Expected power is calculated from measured wind speed and each turbine's power curve — not from a weather forecast — then compared against actual power output.
- See estimated MWh shortfall per turbine, per day, based on measured conditions
- Feed shortfall figures into O&M and warranty review discussions
- Prioritize site visits using production impact alongside alarm status
Alarm Management
Alarms across turbines and OEMs, normalized into one queue with configurable priority rules.
- Stop triaging different OEM alarm formats by hand
- Rank alarms by configured production and safety impact, not raw frequency
- Track alarm status from detection to resolution
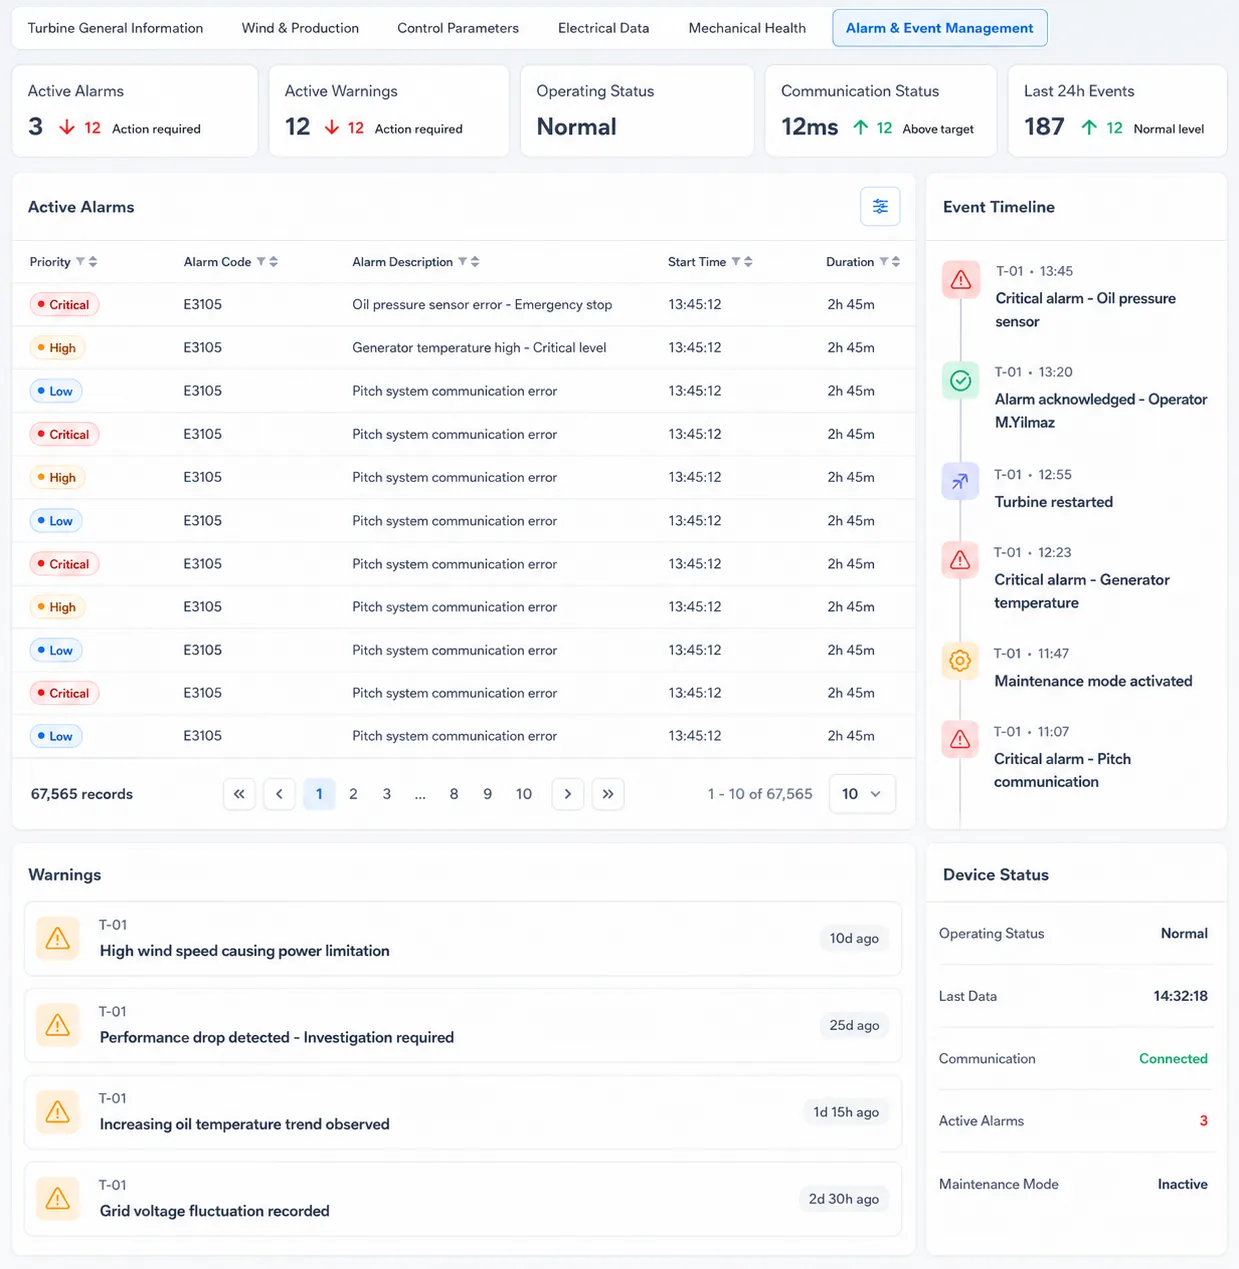
Performance Analysis
Production plotted against wind speed, turbines ranked by efficiency and availability, and downtime broken down by cause.
- Spot when actual production breaks away from the wind-speed correlation
- Rank every turbine by efficiency, availability and alarm count in one table
- See downtime split by cause — planned maintenance, communications, alarms or standby
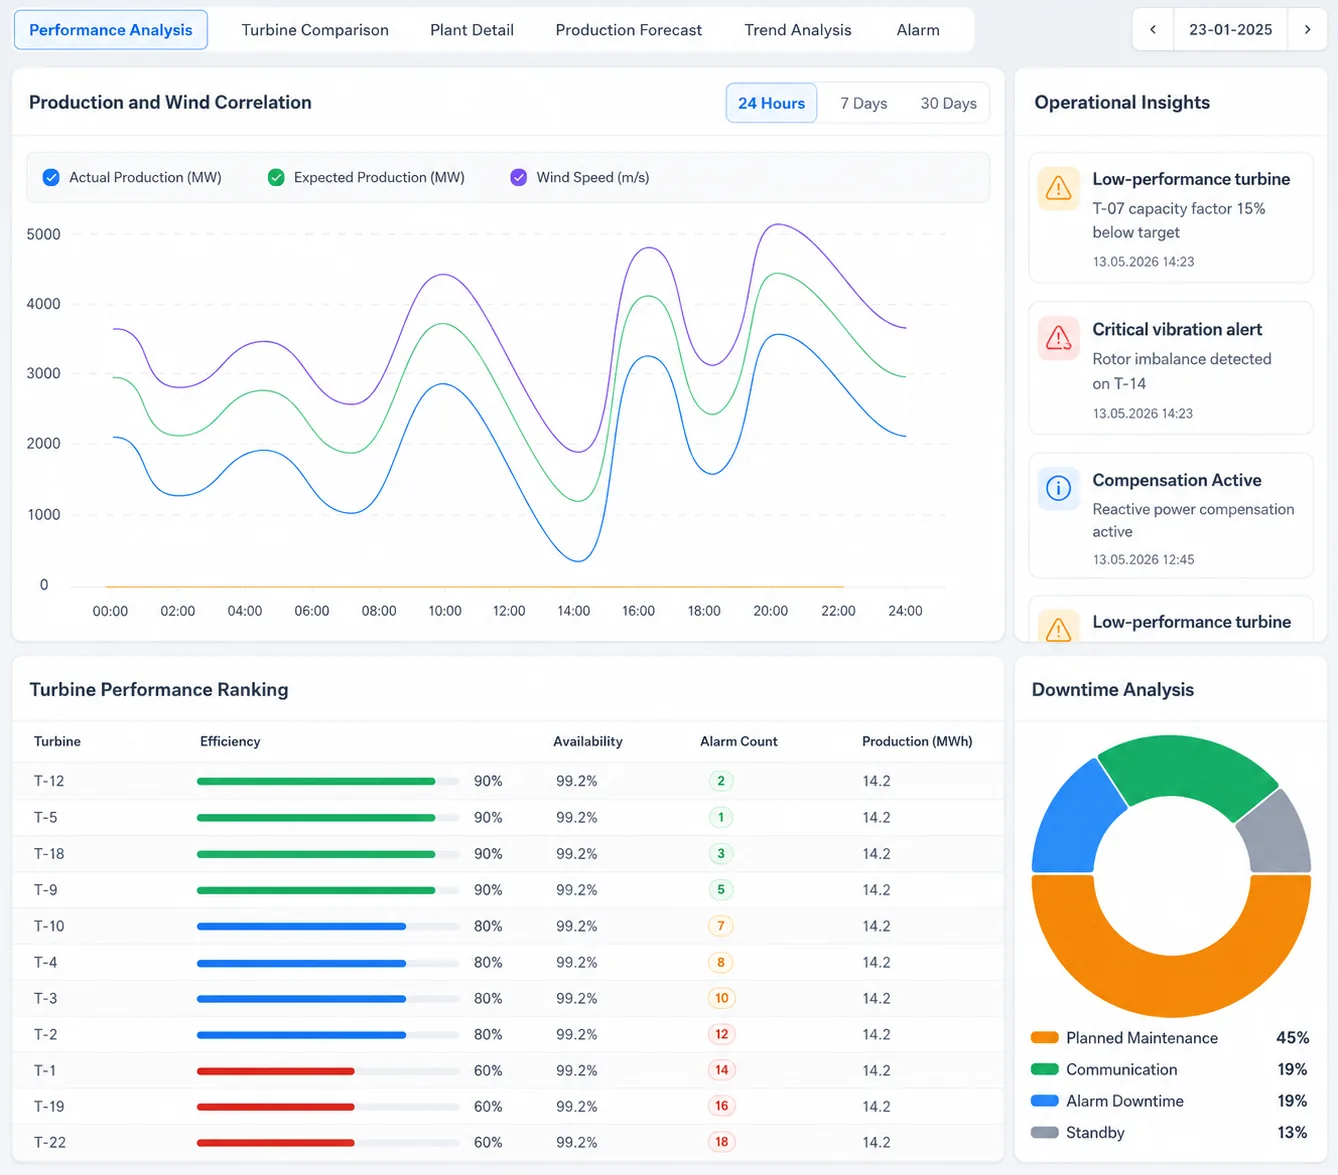
Inside an AlertSee the signals behind every alert.
Every alert shows the underlying signals and the rule that triggered it — so your team can verify the call, not just trust it.
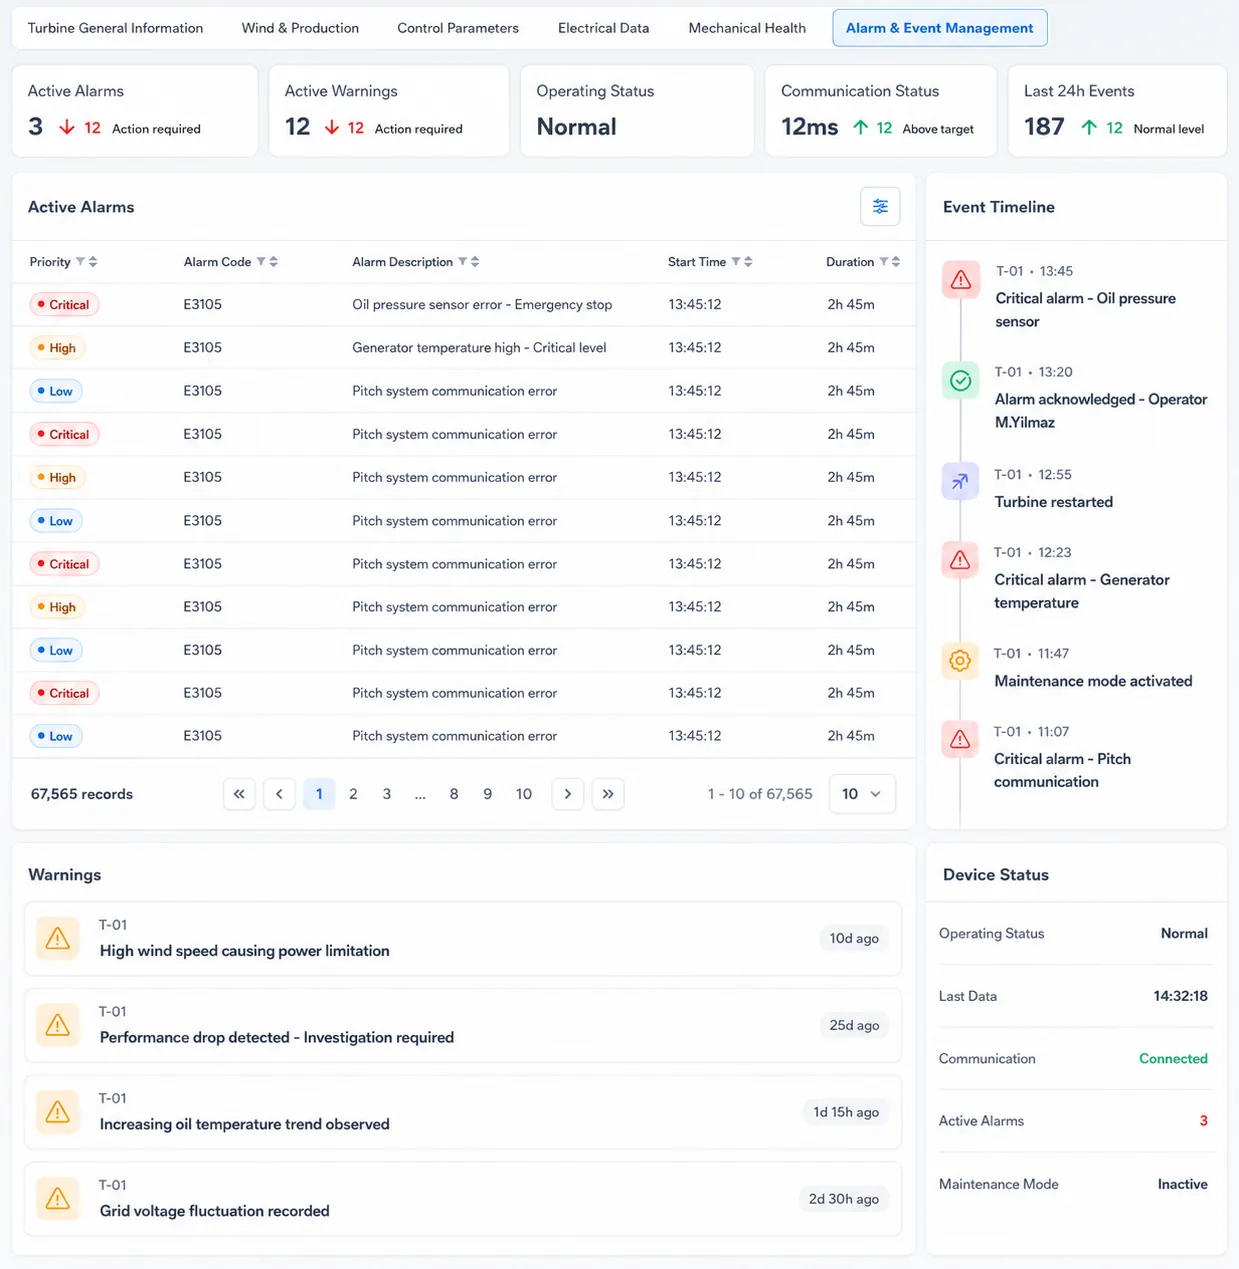
Route flagged alerts like these to O&M for review and scheduling.
Priority is derived from configured rules on signal severity and duration — not a probability score.
The company behind ARMA
ARMA is built .
by Atolla
Atolla develops technology products and solutions built on domestic production, carrying out research and development to produce software and technology for the private sector and for public institutions.
Atolla Bilişim carries out its work in the light of scientific study, bringing universities and the private sector into its R&D activities.
We analyse the requirements in your company and offer you the software solutions you need.
“Our motto is for your energy.”